

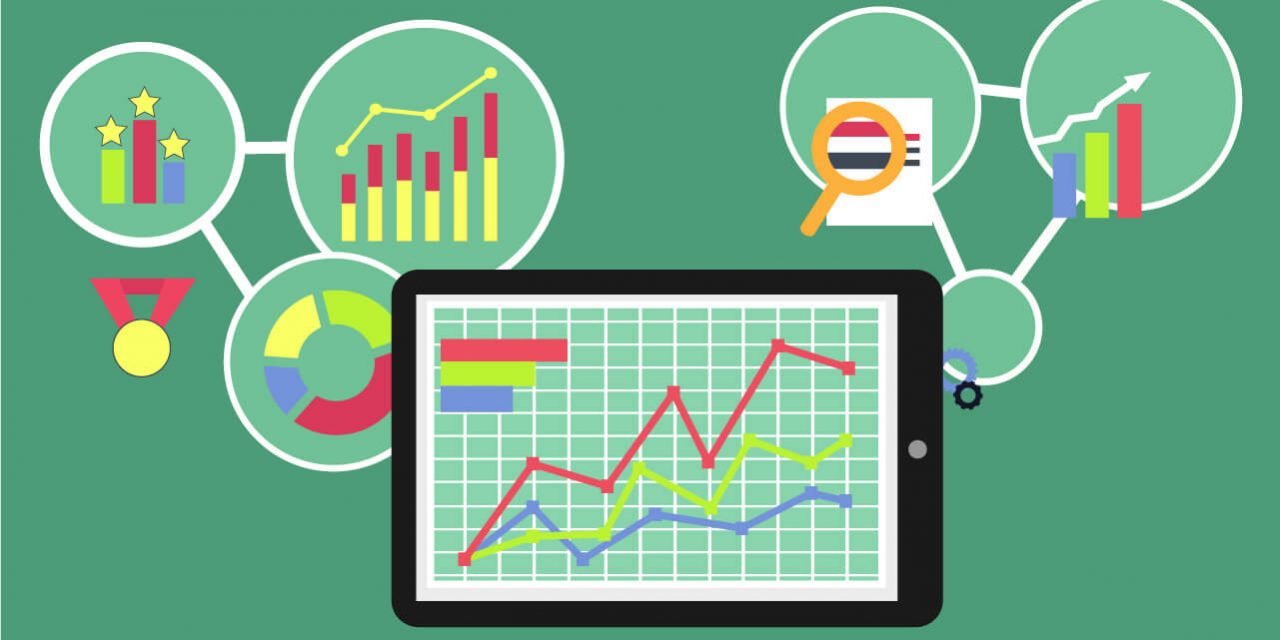

In my social media marketing discourse I have always underscored the importance of analytics in evaluating your social media campaigns. One thing I have grown to appreciate more and more is to be empirical when undertaking an endeavour. If you want to manage anything effectively manage it based on facts, numbers & statistics. These analytics I’m referring to here do justice to this empirical approach.
Analytics are categorized and detailed accounts of the demographics & behaviours of people visiting your website or social media platform. The extent & depth of analytics data varies from platform to platform and you’ll do well to get acquainted with how to access & effectively use this data. Therefore I’m focusing herein on 4 commonly used platforms namely, Facebook, Instagram, Twitter & websites; HOWEVER, I will not dwell on Instagram & Twitter as the thinking approach for Facebook suffices for them.

Analytics have spun an intricate interoperability between measuring the success of your social media campaigns & in turn, also strategizing on how to plan subsequent campaigns.

Crucial Things To Consider
When looking at the data, the most important aspect to closely examine is how engagements (how users are interacting with you through your posts) are for your posts. From engagements the next most crucial thing to check are issues of conversions (actual purchases). Then you have to objectively study the composition and characteristics of people visiting &/or interacting with your platform.

When going through the data don’t focus much on convincing yourself that all is well; have an eye out especially for where you are getting it wrong, where it needs more of your attention & draw inferences between the data and your content & how you are running the platform. The data is supposed to ultimately aid you in identifying what must be done & making informed decisions.
The other important thing is to also note what exactly is working and producing sterling results. The implication there would be that if you reproduce & enhance that for subsequent campaigns it’ll definitely yield the same positive results or even better.

GOOGLE ANALYTICS
This is for websites; I outlined to how to use Google Analytics in my other article on measuring social media campaigns. Here I’m going to make some remarks on effectively using data that you get through this free feature. The data sets/areas availed by Google Analytics are many; let me just highlight three to acclimatize you on how you ought to use the data:

Sources Of Traffic
You get data that details where visitors of your site originate from. This will help you to have a clear picture of how your market is segmented. As in, you will know the geo-locations and respective quantities of people visiting your site. Use this data to know where your market stronghold is such that you know where to place more attention. This data also deals with where people are coming from with respect to avenues e.g. search engine searches, social media platforms etc. Thus you will know which area is dominant such that you focus more on that.

Bounce Rate
So here is what happens when people visit a multi-page website (most commercial websites are more than one page). There is a scenario where people tend to leave your site after just looking at one page. This type of data called bounce rate, is very important for you because it helps you diagnose why people leave your site after looking at one page & which page in particular (i.e. the most commonly looked at page that results in people leaving after viewing it). It helps you consider making some appropriate changes.
Conversion Aspects
The data availed on this focuses on sources, the times & the exact points/instances at which a user makes a decision to make a purchase. This is crucial data because it helps you understand what predominantly leads to conversions for your business. Closely examine this data because sales are critically central to how well a business performs.
In the Facebook the modus operandi is to examine posts with high engagement & make a note as to why so that you replicate and create a recurring strategy from that for subsequent posts. Reach is an enticing metric but don’t be too carried away by that though. The most important metric is engagement which encompasses reactions, comments, shares, views, clicks & negative feedback.

Like I have said before, boosting (sponsoring/paying for) your posts increases your reach, allows you to target your ads & get more details on your ad performance. Check how many people were reached organically & through your paid ad (this helps you evaluate how more people are being reached). Also check the Audience (i.e. gender, age & location).
Let me give an example, I administrate a page that has close to 4000 followers. Here is what I noticed on boosted posts: the reach & engagement are always significantly the highest for Harare province with some provinces having a very little reach & at times even zero engagement. Here is what that data could mean for me; this is a possible indication that there are much fewer people actively on Facebook in other provinces. This would then imply that I must explore other avenues of reaching people in those other provinces.
The other key thing to note is that Facebook gives recommendations premised on how your posts are performing such as boosting or pinning posts etc, it’s wise to heed them.
I used these two platforms as examples to practically show you how you ought to use the analytics data you get; you study, examine & evaluate your campaigns with the thrust of strategically planning for the future. You get to know your campaigns strengths (then you augment them), you realize your mistakes (then you rectify them) & you understand your clientele or customers better (so that you meet & exceed their expectations). At the end of the day you make informed decisions resulting in increased profitability.